Posts

DAX : Calculate average for Last 4 weeks

Hi All if you have average measure and needs to calculate for last 4 weeks then create DAX like shown below using DATESINPERIOD function Average of last 4 weeks = CALCULATE([Average For Report Period],DATESINPERIOD('Date'[Day],LASTDATE('Date'[Week Ending]),-28,DAY)) Average of last 12 weeks = CALCULATE([Average For Report Period],DATESINPERIOD('Date'[Day],LASTDATE('Date'[Week Ending]),-84,DAY))

POWER BI DAX : Complex two layered Average Calculation

Image
Hi All we got a scenario where we have a table with daily granularity and we need to aggregate weekly taking denominator column MAX and numerator column relative SUM and create ratio (percentage). For aggregation above week we need to take SUM of denominator .so layer 1 within week and layer 2 above week format and we need to take averages for the percentage on both layers if you see the image , we need to represent data on weekly basis and  issue here is  [weekly freqency target] is present in all the records of the week in a table, in  above report each row represents weeks data ,so we have to take only one value from those 7 days , so here we need to take Max of that value Compliance %  = Reading towards Complaince/ weekly frequency target Another challange here is Reading towards complaince  may be greater than weekly frequency in those cases we need to consider only 100 % example               Reading towards compalince = 5  and weekly frequency Target = 1        

DAX : Cummulative Sum including Missing dates in Fact

Hi All we got a situation where we need to calculate daily budget , even  if fact table missing some dates we need to calculate for dates Cumulative Budget = VAR RowDate = DateTime[Date] RETURN     CALCULATE (         SUM ( DateTime[Budget]),         FILTER (             DateTime,             DateTime[Date] <= RowDate   && YEAR ( DateTime[Date] ) = YEAR ( RowDate )  && month ( DateTime[Date] ) = MONTH( ( RowDate )

PowerBI : How to Calculate number of WorkingDays between 2 given dates

Image
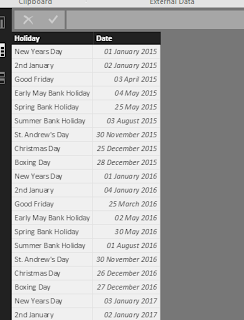
Here i am going to explain how to calculate number of working dates between to given dates. In my approach i am taking a table called Holidays which contains holidays as shown below Once you have this table , we need to use this table in our Datetime table to calculate IsworkingDay column. Now give the relationship between Datetime and Holidays tables as shown below DAX :  IsWorkingDay = IF (NOT(DateTime[Day of Week]= "Saturday" || (DateTime[Day of Week]= "Sunday")) && COUNTX(RELATEDTABLE(Holidays),2)<1,1,0) Now you can create calculated column or measure  Total Working Days Column =  SUMX (     FILTER (         'Datetime',         'Datetime'[Date] >= Tasks[Input Start Date]             && 'Datetime'[Date] <= Tasks[Input End Date]     ),     'Datetime'[IsWorkingDay] ) Total Working Days Measure =  SUMX (     FILTER (         'Datetime',      

How to connect Azure SQL database from PowerBI Desktop

Image
1.        Please check Azure portal to get the Server and Database name based on the database connection strings shown below. 2.        Open Power BI Desktop 3.          3.  Select getdata and search for azure and from the list select azure sqldatabase  and click Connect 4.        Provide the Server nameand database name collected from azure portal

Machine Learning for beginners

I am planning to start my career in Datascience and want to learn what are  machine learning models and algorithms. I have googled Before starting to learn and collected some of the points and wanted to share with you what i understand , we should understand  following main steps in analysis using machine learning models: 1. Diagnosing the data – before defining the possible approaches to work with data, it is necessary to analyse the raw data itself first. What kind of measurements are included,  which kind of models it is possible to apply to the data and defining the initial goal of the research. Try and identify all the metrics that are important to the business. The metrics we are optimising for have a profound effect on the solution we choose, so it is important to identify these early on. It also affects what alternatives there are to machine learning. 2. Data Preparation – merging data, imputing missing values or excluding variables with too many missing values,

PowerBI :Best Method for Versioning Power BI Files and Tracking Incremental Changes to the report

For PowerBI pro License we have the feature called Groups . When we aCreate Group in Power BI ,It  automatically creates  a folder in OneDrive for Business for that Group . The best method for deploying  power BI Report/Dashboard fromPowerBI desktop to PowerBI  service is 1. Once the Report is finished in PowerBI desktop save the file. 2.Place that  .pbix file in Group folder in onedrive for Business 3. From PowerBI service Connect to the new file which is in Onedrive for that group 4.Later if you made any changes to the report , you can place the modified .pbix file in one drive it automatically reflects the change to powerBI when refersh happens